The Input – What the client wants
Our client was a beauty science startup, working on updating their website and needing assistance to help customers understand their value. Their input was rather general, yet specific enough – they wanted to visualize the info about their acne treatment products in comparison to their competitors. However, instead of talking about product benefits, they wanted to emphasize the good feelings and relief people experience after using the products.


The concepts
There were two possible concepts around which we could build an infographic. Namely, we could create the layout around the products, which is OK if the goal were to communicate that content with page visitors, but such a concept would lack any viral potential. Instead, we suggested building an interesting narrative around the emotions that come from using the products, in combination with some amusing facts and features.
Bring in the story
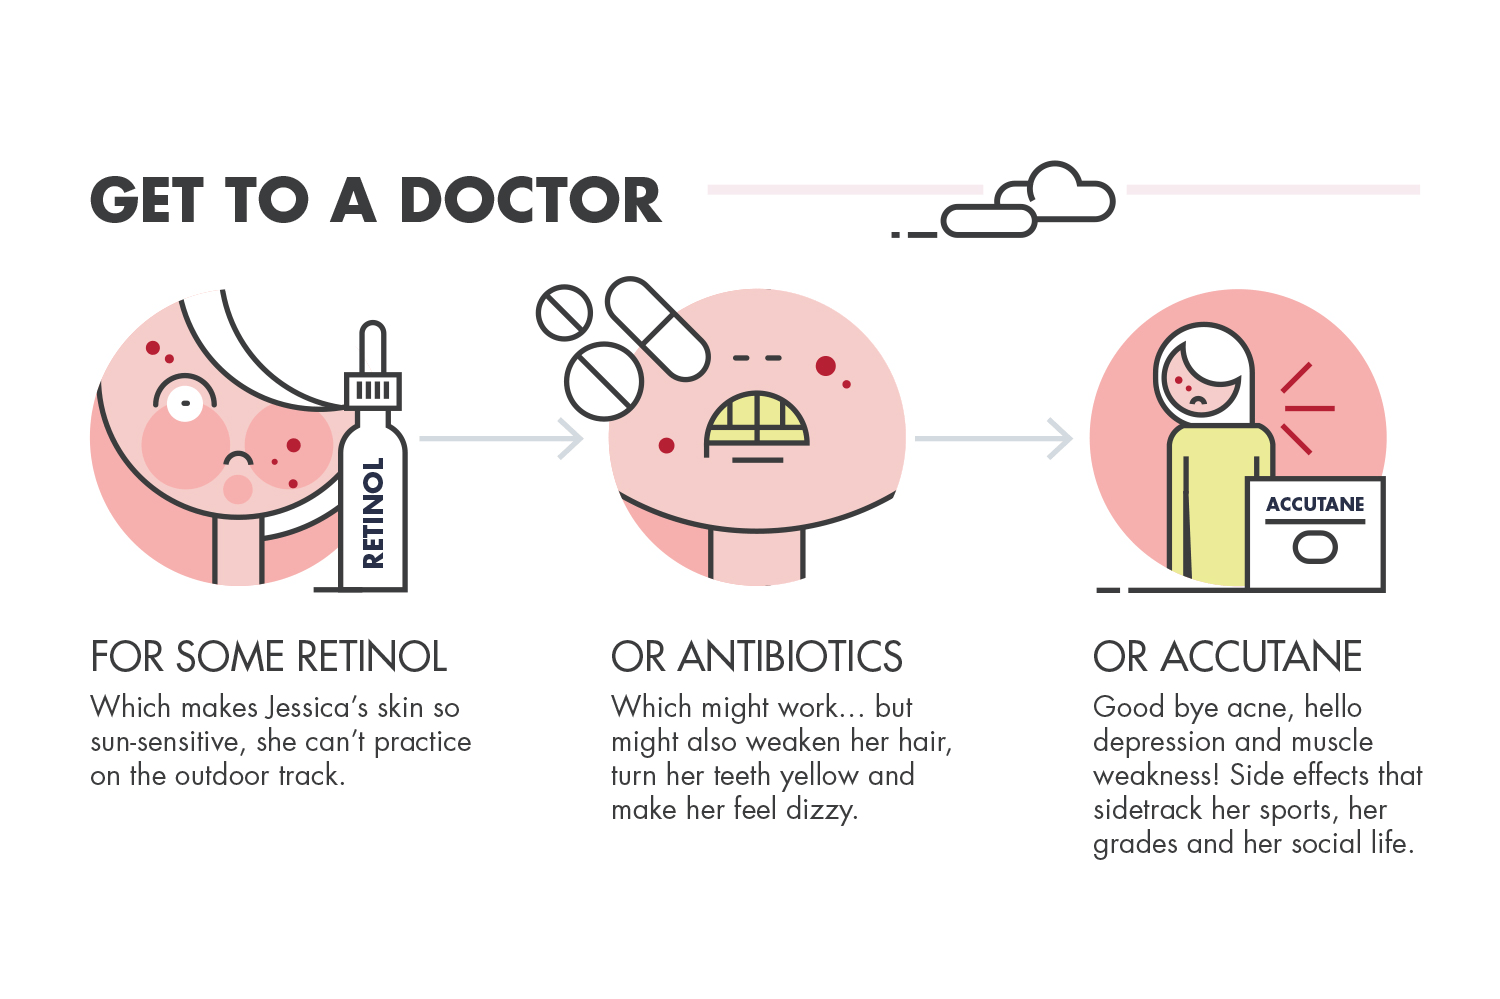
So, we created Jessica, an 18-year old track star with an acne problem. Using the approach of visual storytelling, we structured a plot in which the targeted audience would identify emotionally with Jessica and the difficulties she experiences. At the same time, the stages of her race became the phases in her acne treatment that lead her to glory.


Graphics and additional materials
Once we had defined the story outline, a design wireframe was in order, suggesting a few main character options and other graphic elements that would define a modern 2D flat style. Finally, Jessica would be brought to life in a detailed design draft, leading to the creation of the infographic as an eye-catching piece of visual content. Additionally, micro-content was created while a blog post and social media statuses were created to increase the infographic’s viral potential.
CLIENT:
NERD Skincare (USA)
YEAR:
2016
Source:
